From Static Reports to Interactive Insights: Unlocking Livestock Strategy Data
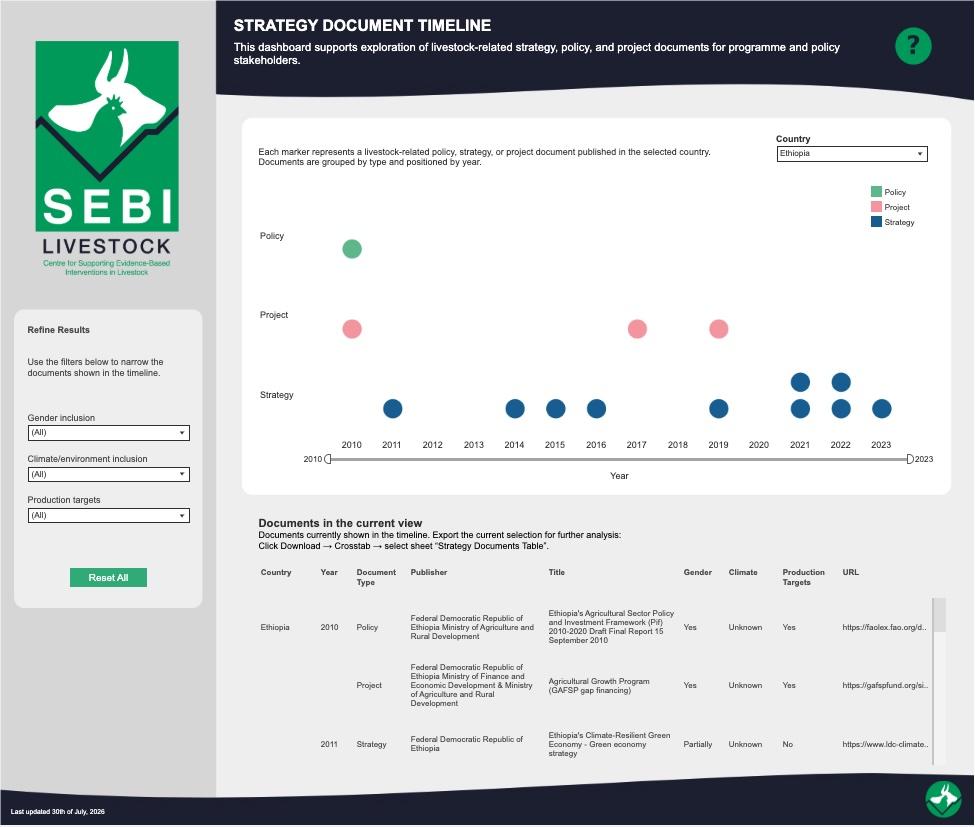
Explore livestock sector priorities with our interactive Livestock Strategy Documents Dashboard.
National livestock strategy documents contain vital information. They outline a country's vision for productivity, animal health, feed development, and genetic improvement. But most of the time, this valuable evidence has remained locked away in lengthy, static PDFs. For policymakers, investors, and researchers, finding specific targets or comparing priorities across different nations has been a time-consuming manual task.
SEBI-L is helping to unlock this critical information through our new Strategy Documents Dashboard.
The challenge of scattered evidence
Strategy documents contain the roadmap for a country's agricultural future. They hold the keys to understanding where governments intend to direct subsidies, how they plan to tackle disease, and what role gender and youth inclusion play in their vision. However, when this information is buried in text-heavy reports, it is difficult to spot patterns. A funder looking to align with national priorities might miss a crucial target simply because it was on page 40 of a separate document. A researcher might fail to see a gap in evidence because comparing baseline data across three different countries required hours of manual extraction.
Explore the data dashboard
Translating complex policy information into accessible data
Our new dashboard addresses this by applying an iterative process of rigorous data preparation and analysis. We have extracted key metrics from multiple strategy documents and structured them into a unified, interactive format hosted on Tableau Public.
Users can now filter by country, thematic area, or timeline to instantly visualise:
- Livestock population and productivity targets.
- Specific goals for disease control and fodder development.
- Commitments to breeding and genetic improvement.
- Strategies for gender and youth inclusion.
Who benefits?
People from across the livestock development community can make use of this tool:
- Government Officials can use the visual clarity to attract investment and monitor progress against their own national plans.
- International Funders can align their portfolios with country ambitions, ensuring money and expertise go where they are most needed.
- Researchers gain a robust source of baseline data to identify evidence gaps and context for their studies.
- Practitioners can anticipate future government projects, helping them make smarter business decisions and access new opportunities.
Why it matters
Data is only powerful if it is usable. By combining rigorous academic analysis with user-focused digital design, SEBI-L is helping to unlock key details from livestock strategies, helping users understand them and inform action. We invite you to explore the dashboard, discover the stories hidden in the data, and join us in making evidence more accessible for a stronger global livestock sector.